RExcel extends graphical capability of Excel - once you installed R-Excel and R program properly - you do necessarily need knowledge of R programming - most importantly R and Rexcel is free. Down side is that RExcel is only available for 2003, 2007 and 2010 Excel versions (download and instructions are here). Easiest way to install would be download the file RAndFriendsSetup2152V3.2-9-1 and follow the install steps.
The Excel add in RExcel.xla permits using R within excel in your figure tips (not necessarily need for programming skills). Here there are two types of servers - background (completely hidden from user and all of the interaction with R should be done within Excel) and foreground (you can access to R graphical user interface while working in R). The backgound server should be installed with the R(D)COM server - which depends upon R package rcom, can be installed from Comprehensive R network. Installation is not that complicated, the above link provides packages that install everything needed.
Although there are different ways to use R within Excel, the most easy way is to use as worksheet function (R functions are called in worksheet). I think for the graphical purpose, this only can help alot to create nice graphics - extending RExcel capabilities.
The following steps are RExcel in Excel 2003. Once every thing set of correctly you can see RExcel in Add-Ins and a new menu appears before Help menu in the corner. Now under menu click run R.

Then you will see menu change and then click R commander with Excel menus. Now whole set of menu are activated for R use within excel. It includes Graphs too.

Select the data area and click put R dataframe, then it will prompt you to get the name of R dataset. So these cells will stay as R data set available for use in later sessions.
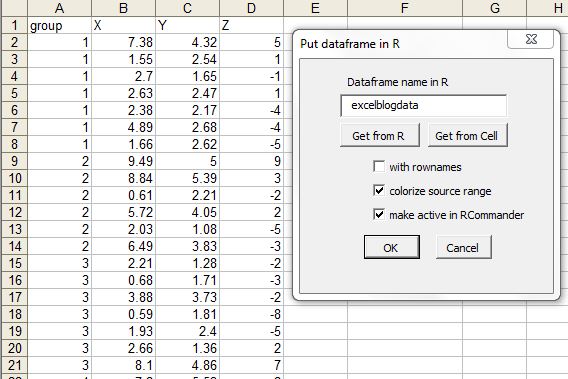
Here I have provided excelblogdata name to the dataset. The dataset name will be listed in Dataset drop down list.

Now let's do some plotting that we can not easily do in excel. Select XY conditioning plot from the Graphs menu in RExcel menu.

Now you can see nice trellis plot (uses R/lattice package) in R plot window.

Plotting 2 variables in Y axis.


Scatter plot matrix is useful when there are many variables. Here we have scatter plot matrix with histogram in the center.

.

Finally there are several other features useful for nice visualization in RExcel. Most importantly it takes some flavor of R to Excel. Happy plotting !
The Excel add in RExcel.xla permits using R within excel in your figure tips (not necessarily need for programming skills). Here there are two types of servers - background (completely hidden from user and all of the interaction with R should be done within Excel) and foreground (you can access to R graphical user interface while working in R). The backgound server should be installed with the R(D)COM server - which depends upon R package rcom, can be installed from Comprehensive R network. Installation is not that complicated, the above link provides packages that install everything needed.
Although there are different ways to use R within Excel, the most easy way is to use as worksheet function (R functions are called in worksheet). I think for the graphical purpose, this only can help alot to create nice graphics - extending RExcel capabilities.
The following steps are RExcel in Excel 2003. Once every thing set of correctly you can see RExcel in Add-Ins and a new menu appears before Help menu in the corner. Now under menu click run R.
Then you will see menu change and then click R commander with Excel menus. Now whole set of menu are activated for R use within excel. It includes Graphs too.
Select the data area and click put R dataframe, then it will prompt you to get the name of R dataset. So these cells will stay as R data set available for use in later sessions.
Here I have provided excelblogdata name to the dataset. The dataset name will be listed in Dataset drop down list.
Now let's do some plotting that we can not easily do in excel. Select XY conditioning plot from the Graphs menu in RExcel menu.
Now you can see nice trellis plot (uses R/lattice package) in R plot window.
Plotting 2 variables in Y axis.
Scatter plot matrix is useful when there are many variables. Here we have scatter plot matrix with histogram in the center.
.