
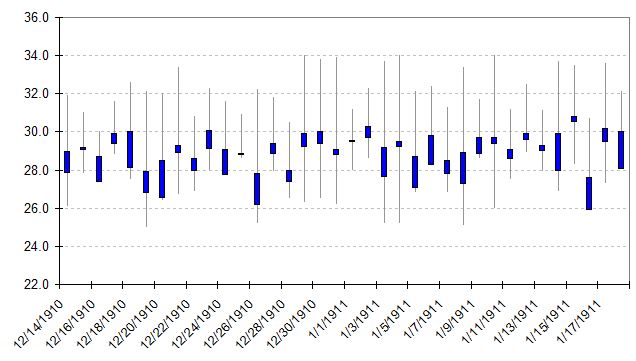
Excel has very nice functions to plot stocks. Here is an example on how to plot Open-high-low-close type stock plot. We need the columns in same order - date, followed by open-high-low-close. Under stock select stock and subtype: open-high-low-close .

Now we got the plot:

Now policing the plot to get final product. Now we can format the data series display and color etc. We might want to get rid of legend.
In similar way we can create High-low-close type stock chart.


Now we got the plot:
Now policing the plot to get final product. Now we can format the data series display and color etc. We might want to get rid of legend.
In similar way we can create High-low-close type stock chart.
How do you add a sma?
ReplyDelete